

How-to#
On this page you can find a gallery of example notebooks that demonstrate the use of CausalPy.
Panel data methods#
Causal methods for longitudinal data where the same units are observed over multiple time periods.
ANCOVA#
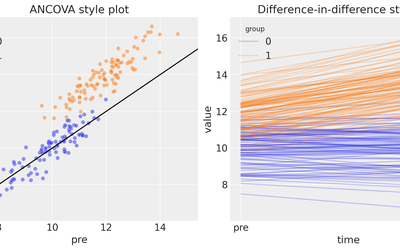
Analysis of covariance is a simple linear model, typically with one continuous predictor (the covariate) and a categorical variable (which may correspond to treatment or control group). In the context of this package, ANCOVA could be useful in pre-post treatment designs, either with or without random assignment. This is similar to the approach of difference in differences, but only applicable with a single pre and post treatment measure.
Panel Fixed Effects#
Panel data tracks the same units over multiple time periods. Fixed effects exploit this structure to control for unobserved confounders that are stable within units or common across time.
Synthetic Control#
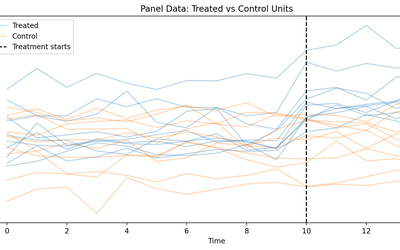
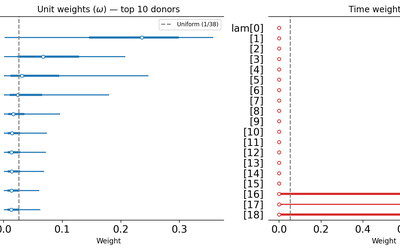
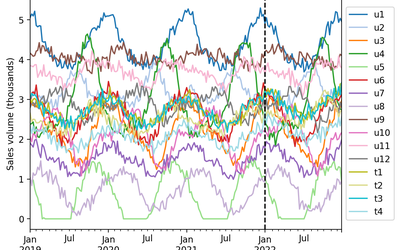
The synthetic control method is a statistical method used to evaluate the effect of an intervention in comparative case studies. It involves the construction of a weighted combination of groups used as controls, to which the treatment group is compared.
pymc models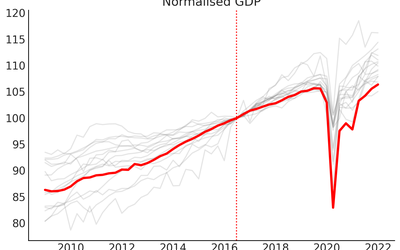
pymc models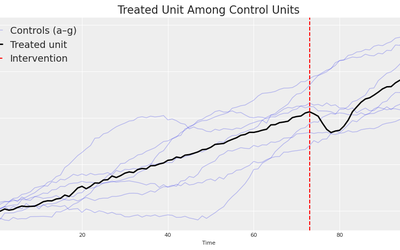
Geographical lift testing#
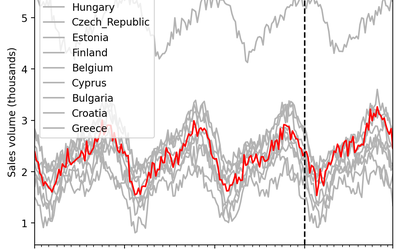
Geolift (geographical lift testing) is a method for measuring the causal impact of interventions in geographic regions. It combines synthetic control methods with difference-in-differences approaches to estimate treatment effects when interventions are applied to specific geographic areas.
Difference in Differences#
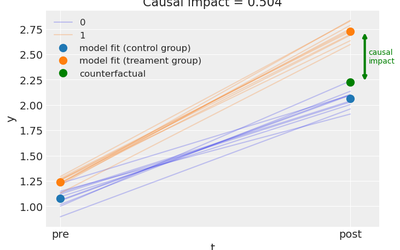
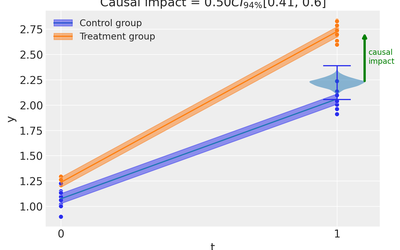
Analysis where the treatment effect is estimated as a difference between treatment conditions in the differences between pre-treatment to post treatment observations.
pymc models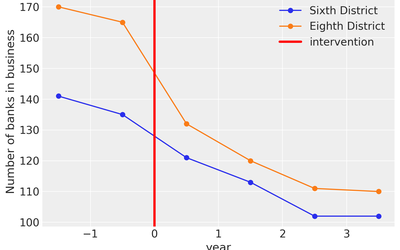
pymc model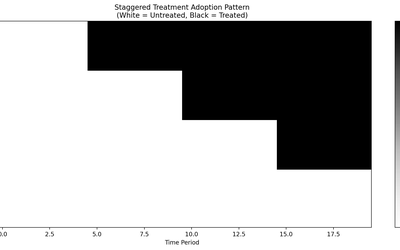
Interrupted Time Series#
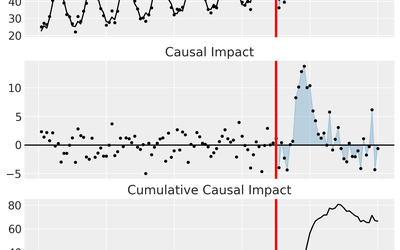
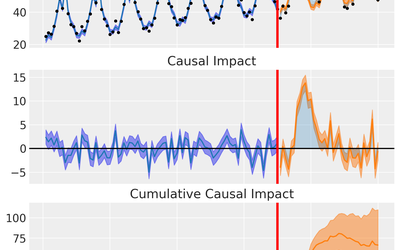
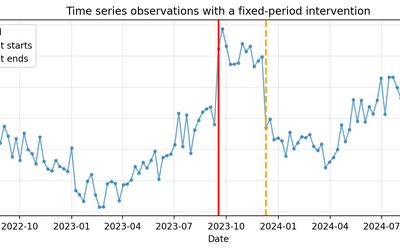
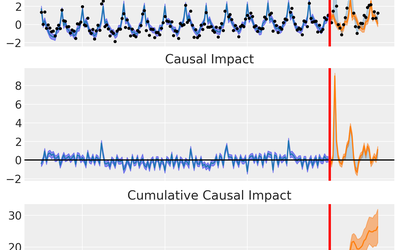
A quasi-experimental design that uses time series methods to generate counterfactuals and estimate treatment effects. A series of observations are collected before and after a treatment, and the pre-treatment trend (or any time-series model) is used to predict what would have happened in the absence of treatment.
Comparative Interrupted Time Series#
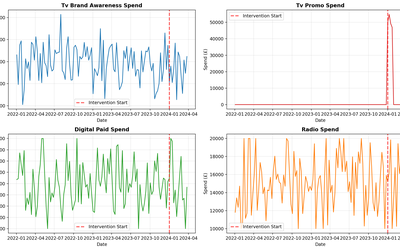
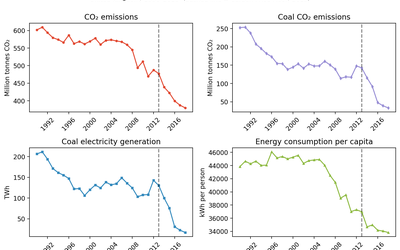
Comparative interrupted time series extends standard ITS by incorporating control units as predictors, helping disentangle treatment effects from coincidental changes that affect both treated and control units.
Piecewise Interrupted Time Series#
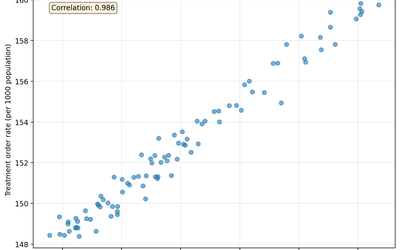
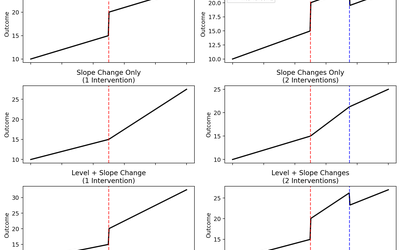
Piecewise interrupted time series (segmented regression) models the outcome with separate slopes before and after the intervention, allowing the level and trend to change at the treatment point.
Cross-sectional methods#
Quasi-experimental designs that identify causal effects from cross-sectional assignment rules, instruments, or weighting.
Regression Discontinuity#
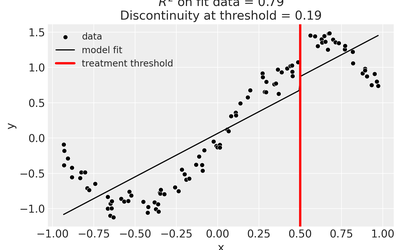
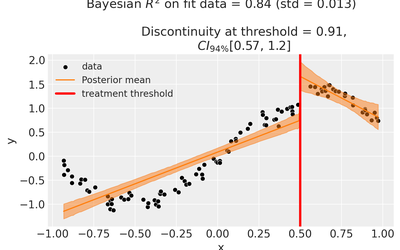
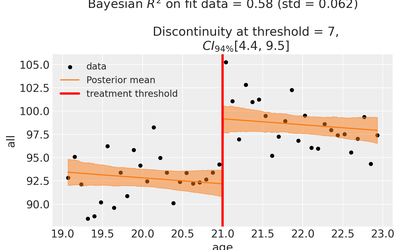
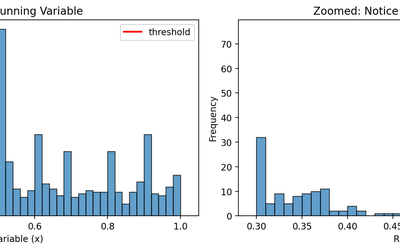
A quasi-experimental design where treatment assignment is determined by a cutoff point along a running variable (e.g., test score, age, income). The treatment effect is estimated by comparing outcomes just above and below the cutoff, assuming units near the cutoff are similar except for treatment status.
pymc models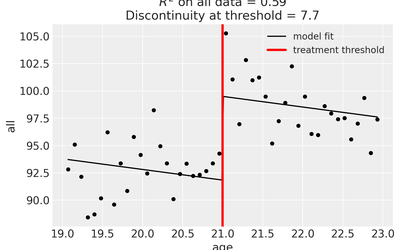
Regression Kink Design#
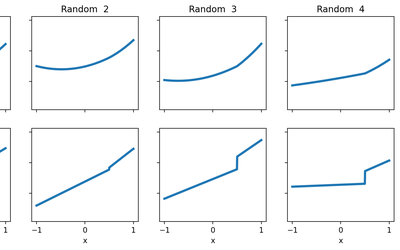
A variation of regression discontinuity where treatment affects the slope (rate of change) of the outcome with respect to the running variable, rather than causing a discrete jump. The treatment effect is identified by a change in the slope at the cutoff point.
pymc modelsInstrumental Variables Regression#
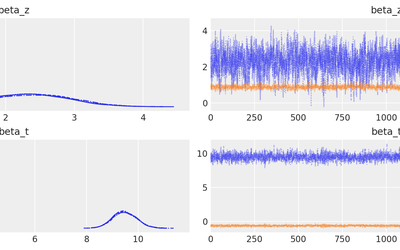
A quasi-experimental design to estimate a treatment effect where there is a risk of confounding between the treatment and the outcome due to endogeneity. Instrumental variables help identify causal effects by using variables that affect treatment assignment but not the outcome directly.
pymc models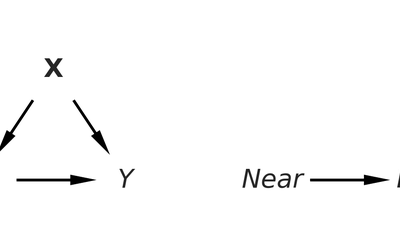
pymc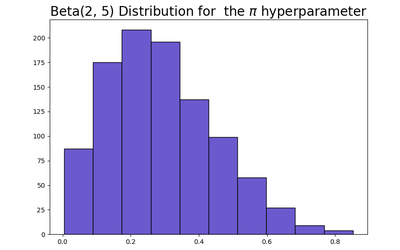
Inverse Propensity Score Weighting#
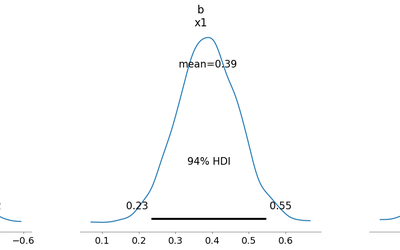
A method for estimating causal effects by weighting observations by the inverse of their probability of receiving treatment (propensity score). This helps adjust for confounding by creating a pseudo-population where treatment assignment is independent of observed covariates.
pymc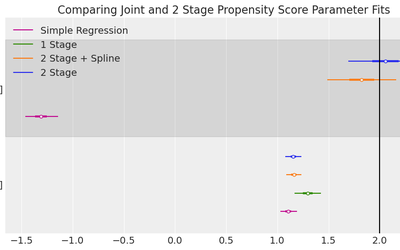
Workflow#
End-to-end workflows for running analyses, sensitivity checks, and reporting results.
Pipeline#
CausalPy’s pipeline API chains causal inference steps into a single, reproducible workflow.

Sensitivity Checks#
Sensitivity checks help assess whether a causal estimate is robust or fragile. CausalPy’s pipeline API makes sensitivity analysis a first-class step in reproducible workflows.
Reporting#
Every CausalPy experiment can produce a self-contained HTML report summarising the analysis.
